This is a default report which allows users to query the AIRA Server Database and generate a graphical report on the number of objects detected per hour per camera. To access the Object Count Graph dialog, click Search > Object Count Graph.
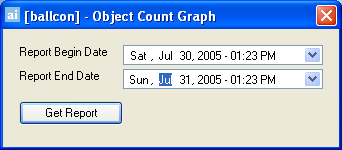
The Object Count Graph dialog opens.
Select a date range to query the data and click Get Report. The Signals Graph dialog appears.

|
|
The Blue line illustrates the average amounts of objects for the current hour (5 minute average) |
|
|
The Green line illustrates the average amounts of objects for the current hour (15 minute average) |
|
|
The Red line illustrates the average amounts of objects for the current hour (60 minute average) |
See Also


