Graphic Maps
Graphic Maps are used to graphically represent the facility or multiple facilities. This module allows the operator to graphically zoom in and out of buildings, view real-time status of devices, and control devices based on their floor plan positioning.
Layout
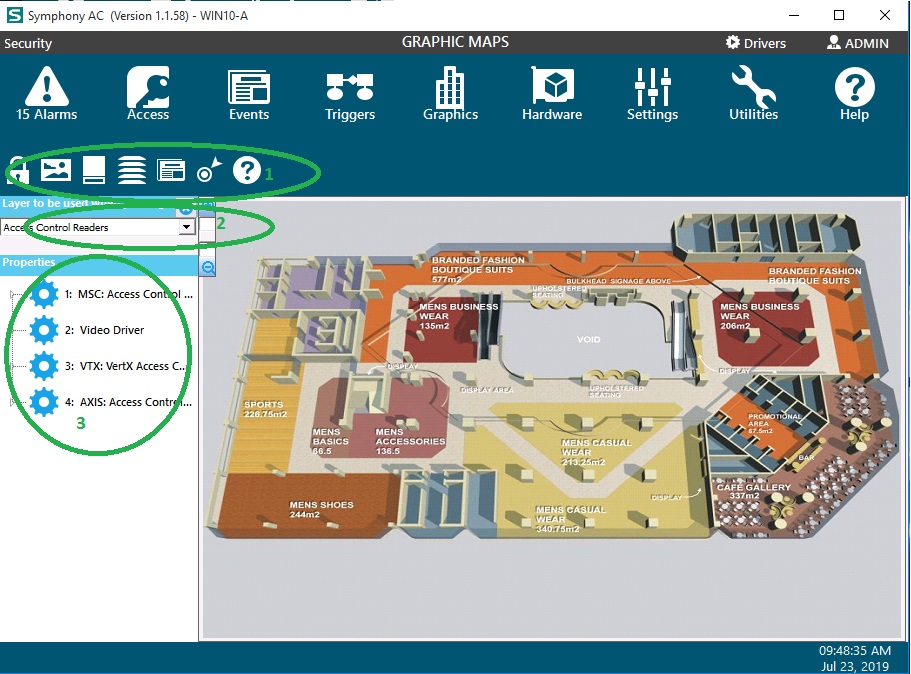
- Command Toolbar - Lock/Unlock, Graphics picklist, Show Description, Layers picklist, Event Manager, Plotting, Help
Creating Maps/Floor Plans
- Up to nine (9) zoom layers can be assigned per Graphic Site.
- Floor plans can be created and saved as jpg, jpeg, bmp (24 bit color), wmf, or emf files.
- Files can be imported from the Graphic Maps tab in Control Panel.
- Maps can be grouped within folders.
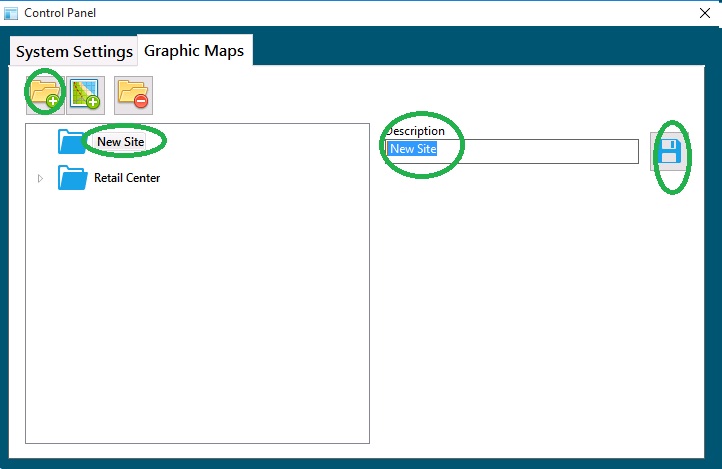
- Go to Settings>Control Panel
- Select the Graphics Maps tab
- To create a new folder, click on the folder icon, then select the 'New Site' below. Under the 'Description' field, enter the name of the folder and click Save.
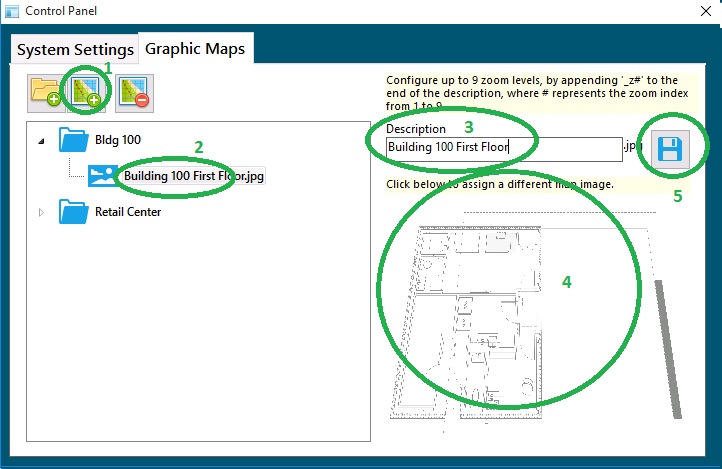
- To add a new map inside this folder, select the folder, then click on the Map icon. Then expand the folder to see the new map and select it. Then click anywhere in the space below the 'Click below to assign a different map image'. Select your map image from. Enter a name in the Description field for the new map. Then click Save.
Selecting a Site
- From the Graphics Icon click on the pad lock to allow editing of the screen.
- Click on the split page icon to display the Graphics configuration screen.
- Click on the Site Navigation tab.
- Select a Site from the tree, the Sites will be arranged by file folder.
- Click on the desired folder and select the graphic map.
Plotting Devices
- From the Graphics Icon click on the pad lock to allow editing of the screen.
- Click on the split page icon to display the Graphics configuration screen.
- Click on the Plotting tab.
- From the drop down arrow to the right of the Layers to be used when plotting select the type of device that will be plotted. For example, if an access control reader will be plotted select the Access Control Readers option.
- From the Hardware Tree select the device to be plotted and with the left mouse button selected drag the device to floor plan on the right.
- The device can be plotted anywhere on the graphic and can be moved using the drag and drop method.
- Once the device has been successfully plotted the operator will now be able to right mouse click on the device and control the hardware.
Layers
Layers are used to designate which devices will be shown on a graphic map. For example, if cameras are plotted under the Camera layer and this layer is deselected, the plotted cameras will not appear on the graphic map. This allows the operator to see only those devices that are necessary for daily monitoring.
- From the Graphics Icon click on the pad lock to allow editing of the screen.
- Click on the split page icon to display the Graphics configuration screen.
- Click on the Layers Tab.
- Place a check in the box to the left of all the layers which should be visible on the graphic map. The devices will correspond to the layer assigned using the plotting option.
- If the box is not checked to the left of the layer the device(s) will not appear on the graphic map for control.
- Default Layers include the layers listed below. Layer names can be modified.
- Fire Alarm Devices
- Security Devices
- Cameras
- Access Control Readers
- Control Points
- Door Strikes
- Assets
- Lights
- Computers
- Request to Exit