|
Article Type:
|
How To
|
|
Product:
|
Symphony
|
|
Product Version:
|
6.10
|
|
Component:
|
Reports
|
|
Device Brands:
|
|
|
Created:
|
9-Apr-2014 9:10:56 AM
|
|
Last Updated:
|
|
Heat Map Image Reports table data
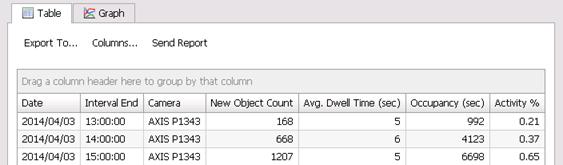
If you have an existing Heat Map Report from a Senstar Symphony release prior to 6.10.1, you will notice new report data when you upgrade to a later version of Symphony. Prior to Symphony release 6.10.1, the Heat Map Image Report included the following columns of table data for each time interval: | Column Heading | Details |
|---|
| New Object Count | The number of objects detected within the heat map zone | | Avg. Dwell Time (sec) | The average time that the objects counted were in the heat map zone | | Occupancy (sec) | The New Object Count value multiplied by the Avg. Dwell Time value | | Activity % | The average percentage of pixels in motion within the heat map zone |
As of Symphony release 6.10.1 and later, the Heat Map Image report data is broken down by count and average time against a Dwell Threshold value for aggregated or individual time intervals: | Column Heading | Details |
|---|
| Below x sec. (Count) | The number of objects detected within the heat map zone for less than the dwell threshold | | Above x sec. (Count) | The number of objects detected within the heat map zone for more than the dwell threshold | | Below x sec. (Avg Time) | The average length of time objects were detected within the heat map zone for less than the dwell threshold | | Above x sec. (Avg Time) | The average length of time objects were detected within the heat map zone for more than the dwell threshold |
Note: The Dwell Threshold value is configured as part of the Heat Map report’s sensitivity parameters. 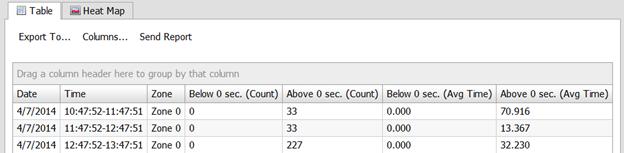
|
Average rating:
|
|
|
|
Please log in to rate.
|
|
Rated by 0, Viewed by 5301
|
|